Covid Tracker
This personal project was built during my bootcamp at Concordia University. I wanted to create a web app to track the covid situation all over the world with some key numbers.
Purpose
As a final project, I had to showcase that I have a been learning all along the bootcamp and implement them effectively.
Details
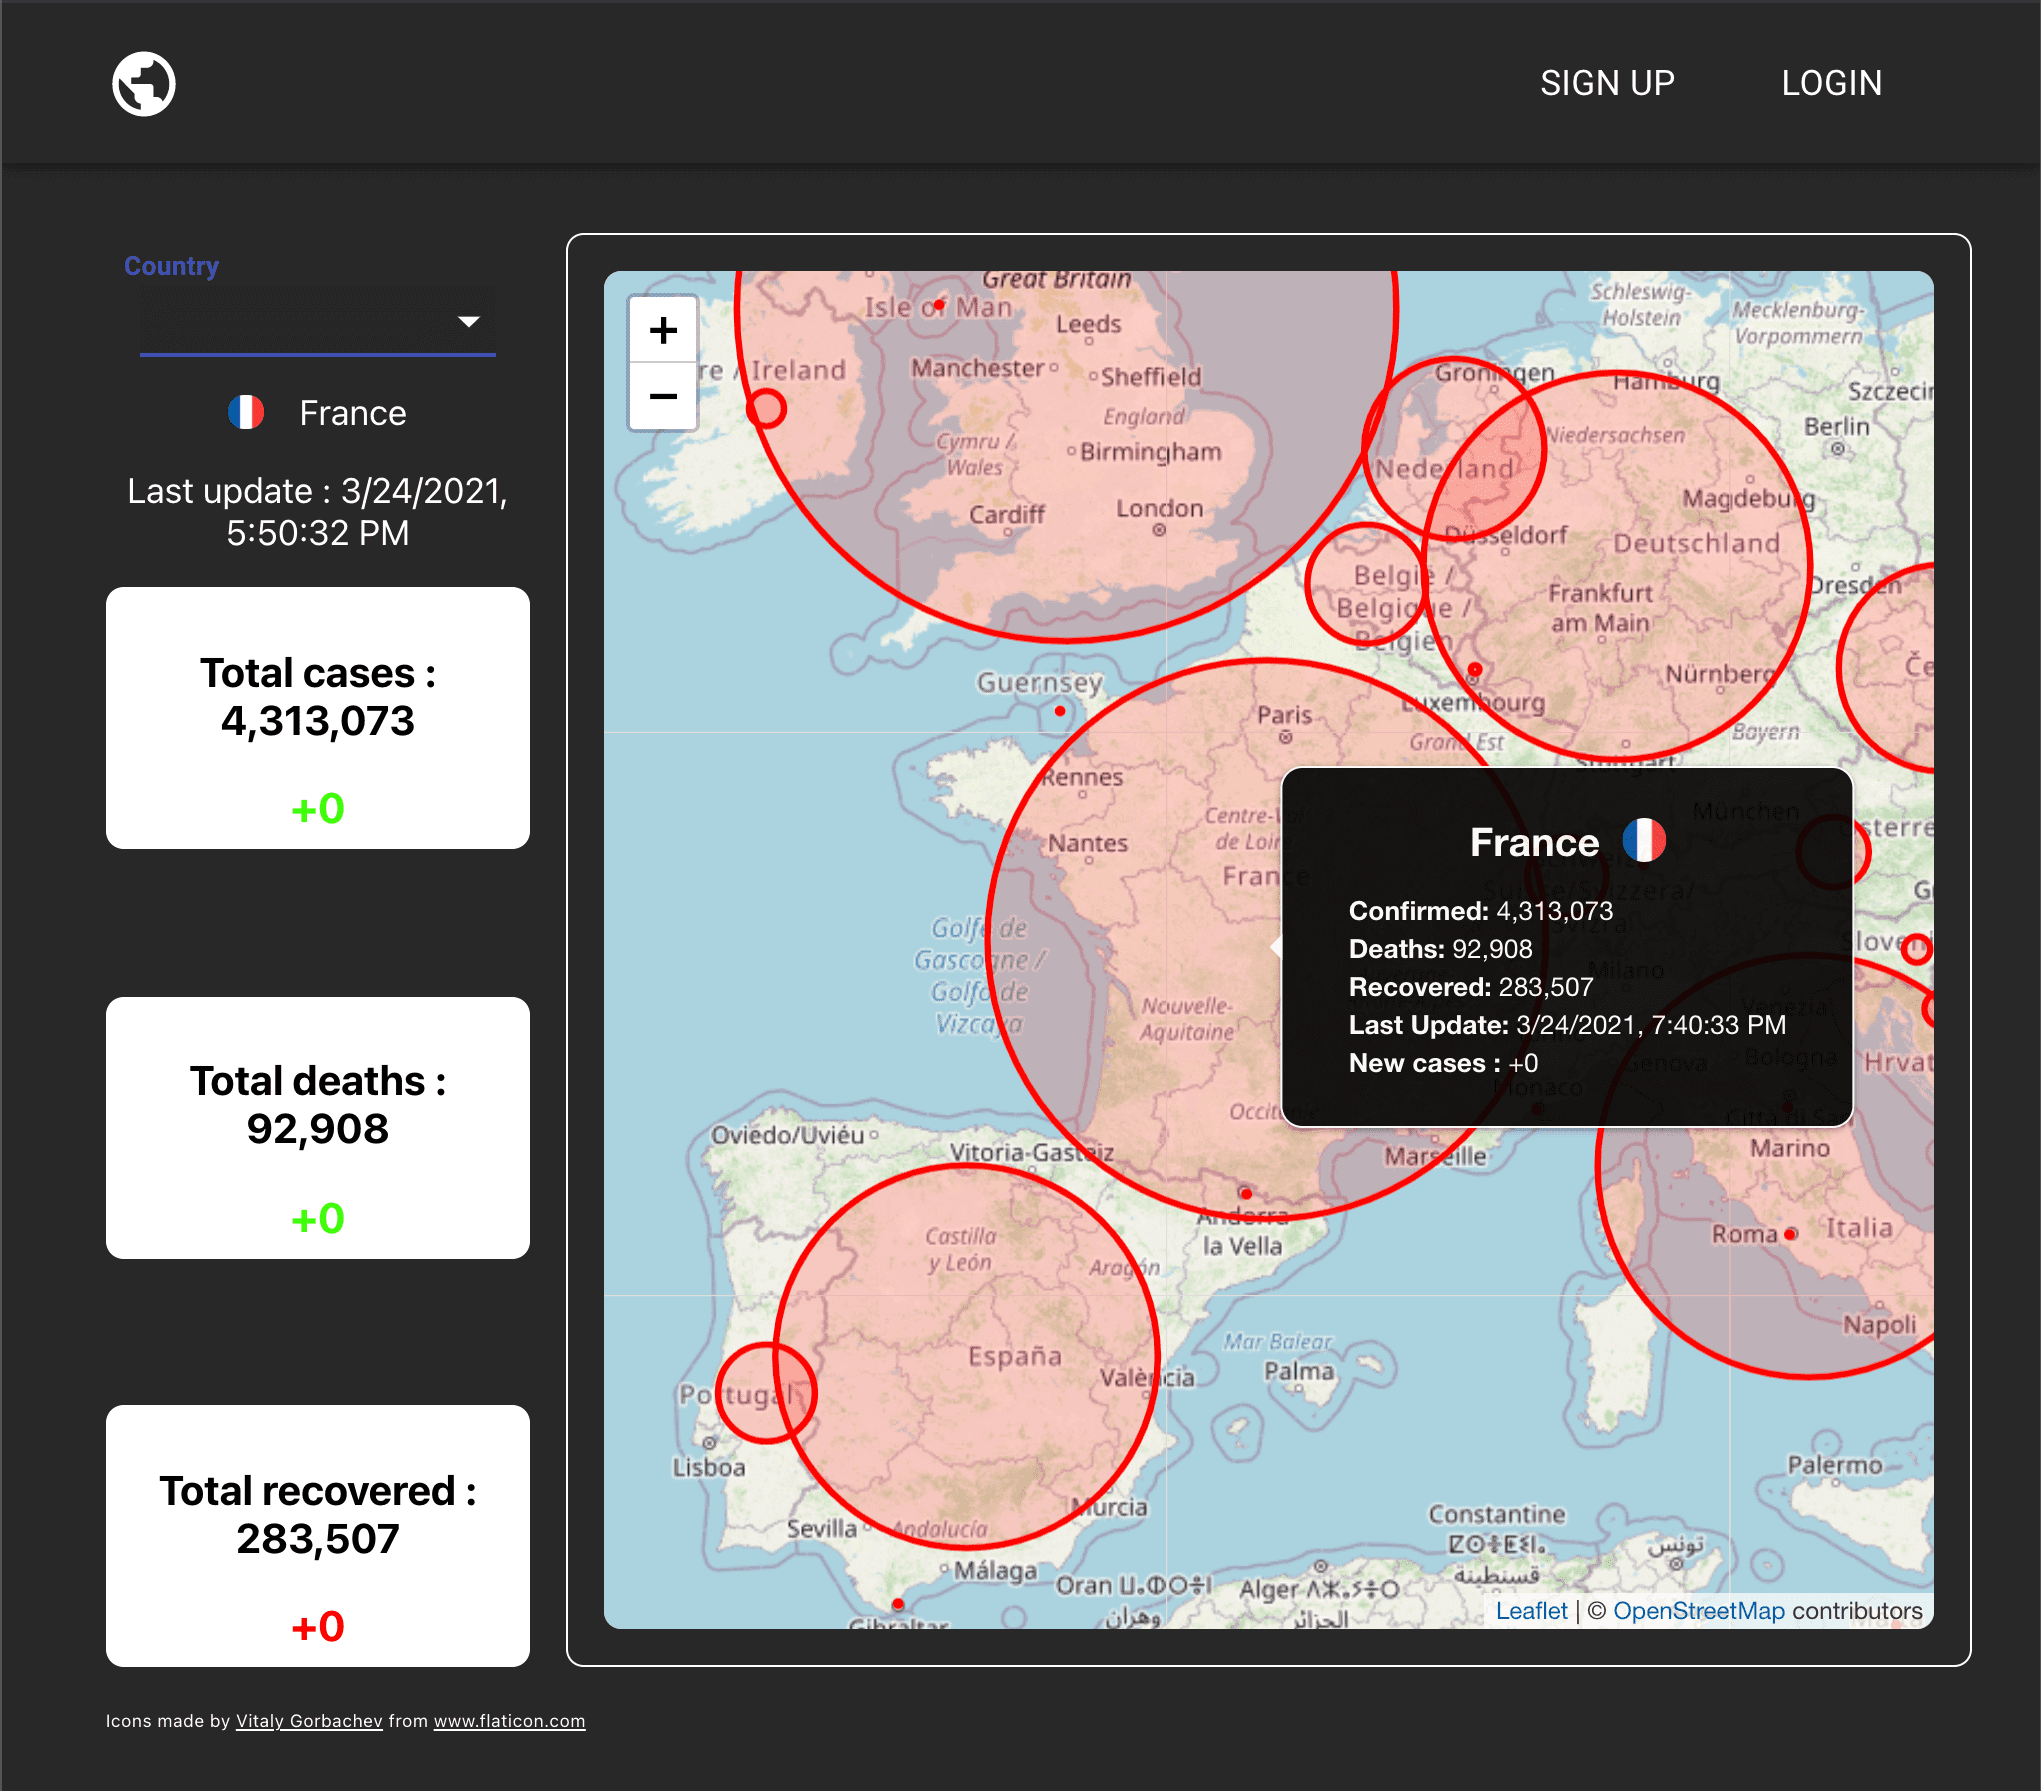
The user arrives on the homepage where is displayed a kind of heatmap but with circles. When hovering on them it will display some key infos. These data are fetched directly from Disease.sh API, implemented in the back-end.
On the left side, a dropdown selector will give you all the countries. After choosing one of them, the user will see detailed numbers compared to the previous day informations.
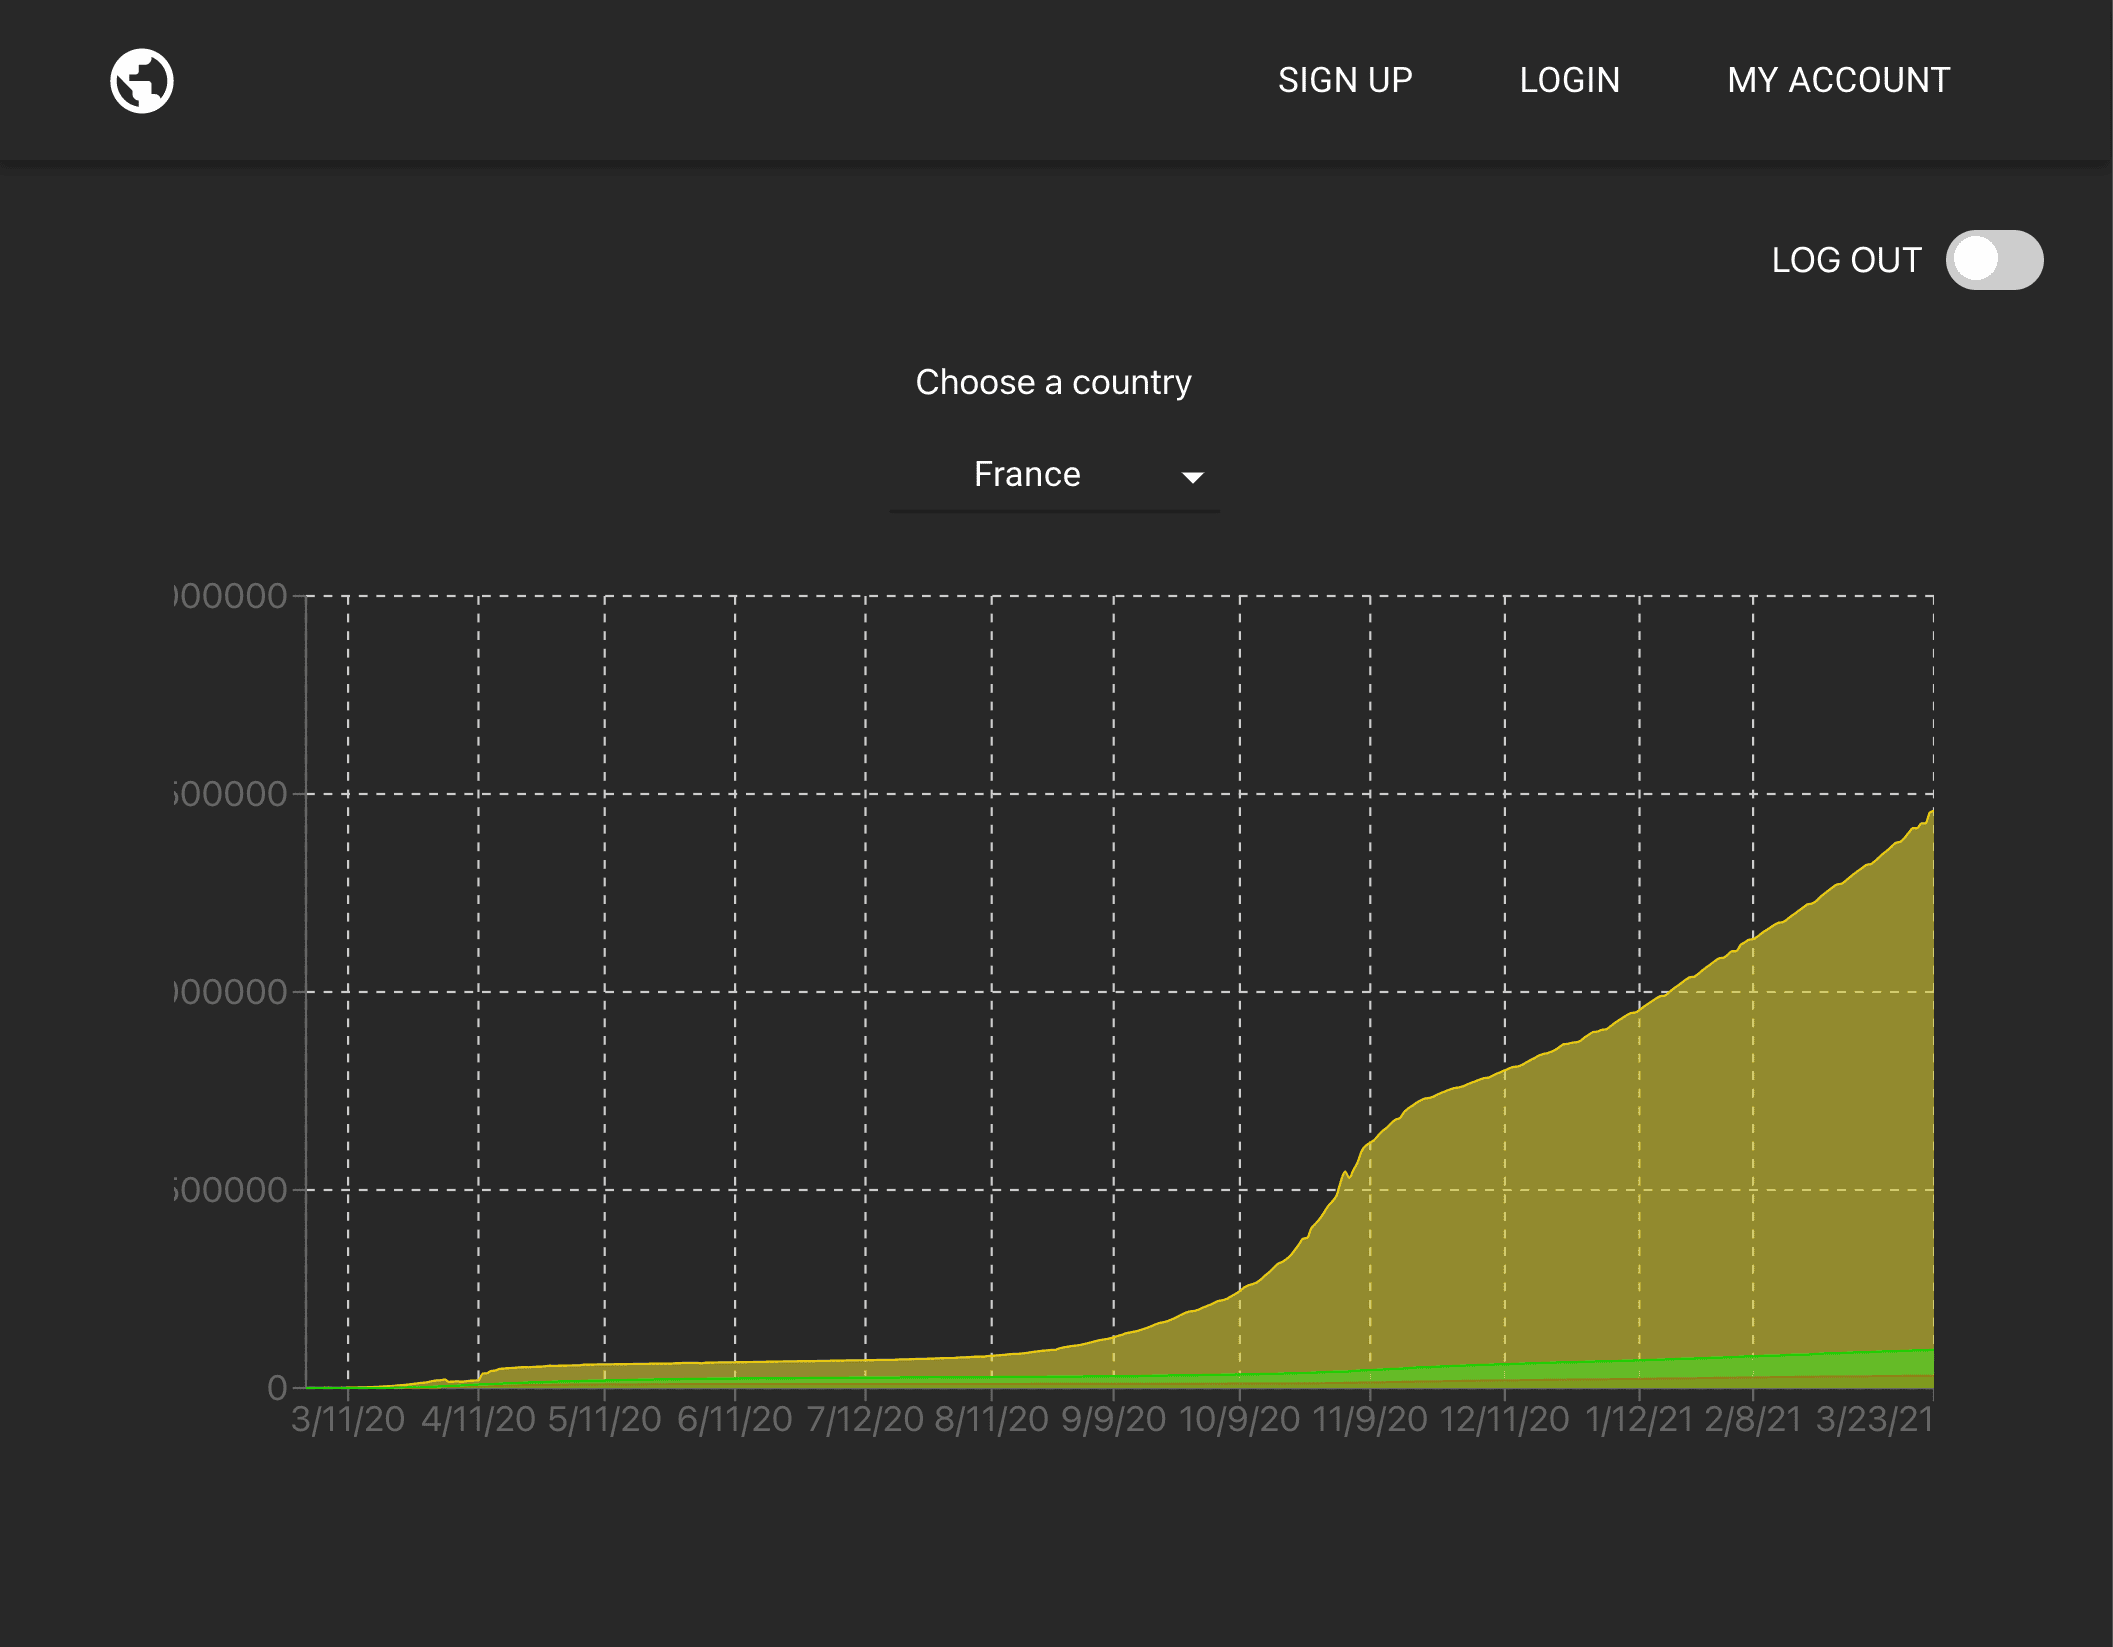
The user has also the ability to create his own profile, using the Firebase Authentication system. Once they are authenticated, they will get access to a personal page where a chart can be displayed and show the trend to a specific country.
Tech
○ React
○ Node
○ Express
○ Firebase / Cloud Firestore (deployment, Auth and Database)
○ Styled Components
○ React Leaflet (map)
○ Recharts (chart)
○ Heroku (back-end deployment)
Lessons
This project was a great opportunity to apply the skills that I learned, more specifically on React. One challenging part was the implementation of the Leaflet libray (world Map), the documentation was not really explicit and a lot of testing and research were necessary in order to set all things up. I really enjoyed implementing the Firebase authentication system and the chart library (Recharts). This was an opportunity to learn new technologies and figure out by myself how to make everything work. This was a really challenging project but also rewardful as it helped to improve my code structure and problem-solving skills.

